
Help
1. FAQs
Why is the volume different to other platforms?
Because stonicks takes into account the splits and the dividends in order to calculate the volume.
How often is the stock market source data updated?
The stock market data is obtained from Xignite, therefore, it depends on Xignite. Usually, closing market prices are available from the previous day.
I cannot see the graphs properly. What are the basic requirements?
The minimum version required of Internet Explorer is version 9. The latest version of Internet Explorer for Windows XP is version 8, therefore, if you want to use Stonicks on Windows XP we recommend you to install other browsers, for example, Mozilla Firefox or Google Chrome. If you work with a tablet, you will be able to use Stonicks through the tablet browser, as you would do on a personal computer.


2. User manual
2.1. Upper header
2.1.1. Stonicks Button
Click on Stonicks Logo to access the main page and load the default graphic.
2.1.2. Login and register

2.1.2.1. Log in
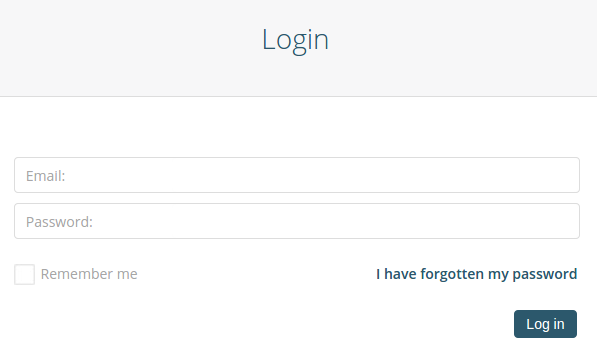
To login, fill in the form. Introduce your email address and password. If you forget your password, click on the link "I have forgotten my password".
Tip: Tick the box Remember me in order to keep the login parameters in your browser; in doing this you will not have to introduce your login data the next time you access the web.
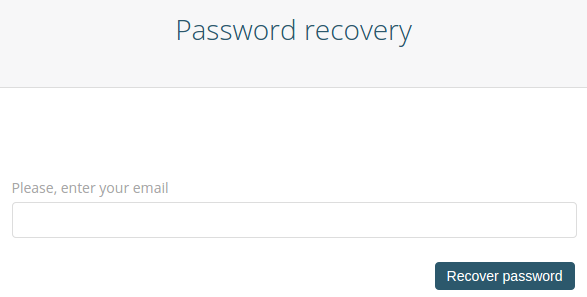
Enter your email address in order to recover your password.
2.1.2.2. Register
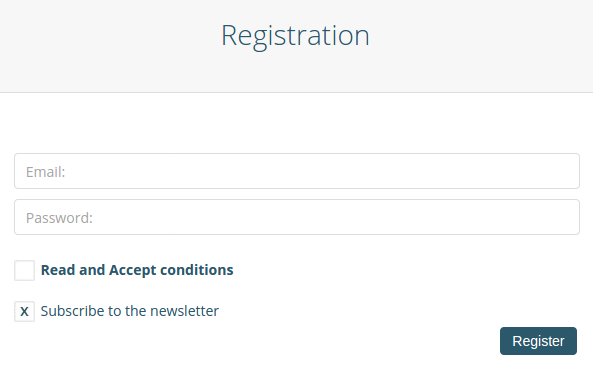
Complete the form in order to register in Stonicks. Enter your email address and password. Your account will be activated straight away.
2.1.3. Language

Choose the language. Select the desired language by clicking on the corresponding link in the top right corner. For Spanish select ES, and for English select EN.
2.2. Lower Header
2.2.1. Basic share information
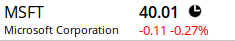
Basic share information that is shown in the graph. From left to the right, and from top to bottom, value of the close price, complete name of the company, variation of the day and percentage variation of the day.
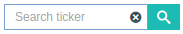
2.2.2. Tickers Searcher
Look for the share you are interested in, on the Xignite database, by using its ticker. In order to do this, introduce the share symbol or the name of the company. There is also the option of ´Autocomplete´ to make the search easier.
As a result of the search, a list will appear showing the securities found within the parameters of the ticker, name of the company and password with which the user is operating.
Important: the ´Autocomplete´ function shows firstly the results of the shares with the greatest quantity. Generally, the number of shares is a good indicator of the relevance of the shares.
2.2.3. Undo

Click on this button to undo the last action on the chart.
2.2.4. Redo

Click on this button to redo the last action on the chart.
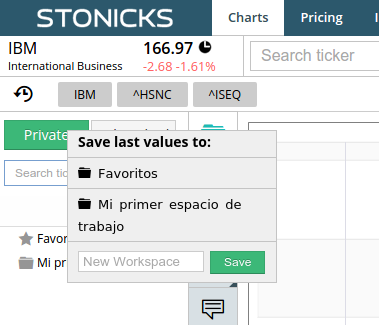
2.2.5. Save

When save is clicked, if the current graph was open from a workspace, it will be directly saved. Otherwise, a drop-down list will show the available workspaces so you can choose where to save it.
Each graph is always stored using the ticker name as identifier which cannot be changed.
There is possibility to create the workspace from this menu by specifying the name.
2.2.6. Save all

Using this option, the current graph will be stored in all workspaces where it is found, identifying it through the ticker name.
Tip: this option should be used carefully as it can override the previous analysis that you may not want to lose.
2.2.7. Save in Favourites

Saves the current graph in your Favourites Workspace. If the workspace has not been created, it will be done so automatically.
2.2.8. Delete

Deletes the graphic elements, inserted by the user, which have been selected.
2.2.9. Delete all

Deletes the graphic elements inserted by a user, selected or not.
2.2.10. Share

Allows user to share a picture of the current graph, with all its elements, as a link, using email or through social networks.
2.2.11. Cofiguration

Sets the different configurable options of Stonicks.
2.2.11.1. Interface
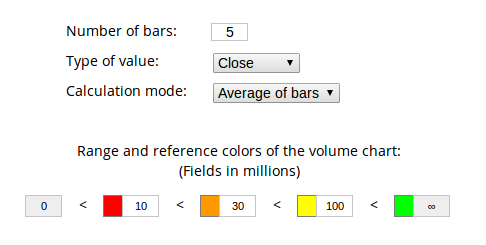
2.2.11.1.1. Volume
The configuration of the volumen can be used as a visual help to detect Tickers with a certain medium volume or minimum.
Number of bars: Especify the number of intervals (Daily, weekly or monthly) to consider in the calculation from the current date.
Type of value: The value by which the number of daily transactions will be multiplied (opening, close, maximum or minimum).
Calculation mode: Chose if you want to consider the average volume value of the n bars (Average of bars) or ir you want to consider the minimum (Minimum of bars).
Colours: Define the colours for each volume range in millions (currency).
Once you have defined the parameters, the volume icon will adopt a color depending on the settings you made.


2.2.11.1.2. Tools
Allows you to choose the position of the side tools bar: on the left side or below the horizontal bar.
2.2.11.2. Graphic
2.2.11.2.1. Graphic
Auto-thickness of the bars:Allows you to activate/deactivate the auto-adjustment of the thickness of the bars with zoom. A bar is understood as a line in the graph to represent values in a given period of time or transitions between consecutive time periods.
Thickness of the bars:Allows you to specify the thickness of the bars (in pixels)
Color bars:Allows you to establish the colour of bars.
Linear/logarithmic scale:Lets you determine the type of scale.
Auto-resize:Allows you to activate/deactivate the auto-rescaling function of the graphs when it is moved in the time axis.
Improve readability:Allows you to activate/deactivate the option to improve the reading experience, increasing the size of the smallest fields such as the numbers in the coordinate axis.
2.2.11.2.2. Data
# Tickers in local cache:Allows you to establish the number of tickers that are stored in the browser local cache once they have been displayed. Tickers stored in local cache will be available until the page is reloaded or the browser is closed, and they are recovered from the local browser memory which is much quicker than the Ws calls!
Include splits: Applies splits adjustments indicated by Xignite and adding a mathematical logic to improve the result; and None, that does not apply any adjustment.
Include dividends:Allows including mathematical adjustments based on dividends indicated by Xignite!
2.2.11.2.3. Dimensions
Allows you to modify the highest value and the lowest value.
2.2.11.2.4. Date range
Specifies the starting date, the end date and the number of extra bars.
2.2.11.3. Technical indicators
The parameters of the indicators can be modified from the general configuration menu and by clicking the left button of the mouse on the graph of an indicator.
2.2.11.3.1. Pivot
Modifies the colour of the graph to depict maximum and minimum in blue and red respectively. The pivot value can be configured, and it determines how many bars are considered in the calculus.
2.2.11.3.2. RSI
Allows user to configure the value of the parameters: Period, Higher Band and Lower Band.
2.2.11.3.3. SMA
Allows user to configure the value of the parameter period of all three SMA indicators.
2.2.11.3.4. EMA
Allows user to configure the value of the parameter period of all three EMA indicators.
2.2.11.3.5. WMA
Allows user to configure the value of the parameter period of all three WMA indicators.
2.2.11.3.6. Keltner Channels
Allows user to configure the value of the Keltner Channels parameters: the period, the multiplier and the type of price.
2.2.11.3.7. Stochastic
Allows user to configure the value of the parameters of the Stochastic indicator: the period, SK, SD, Higher Band, Lower Band and the type of Average.
2.2.11.3.8. MACD
Allows user to configure the value of the parameters of the MACD indicator: the value of the slow period, the quick period, the signal period and the band and type of price.
2.2.11.3.9. Bollinger Bands
Allows user to configure the value of the parameters of the Bollinger Bands: the value of the period and the multiplier, and the type of price.
2.2.11.3.10. Range Channels
Allows user to configure the value of the period in the GWI.
2.2.11.3.11. SAR Parabolic
Allows user to configure the value of the parameters coefficient of acceleration and maximum acceleration of the parabolic SAR.
2.2.11.3.12. Momentum
Allows user to configure the value of the period of the Momentum indicator.
2.2.11.3.13. Rate of Change
Allows user to configure the value of the period of the Rate of Change (RoC).
2.2.11.3.14. %R Williams
Allows user to configure the value of the period of the indicator % R Williams.
2.2.11.3.15. Ac Distributed
2.2.11.3.16. ADX
Allows user to configure the value of the period of the indicator ADX.
2.2.11.3.17. ATR
Allows user to configure the value of the period of the indicator ATR.
2.2.11.4. Studies
2.2.11.4.1. Create study
Allows user to create studies to configure the colour of the bars of the graph by defining a set of rules.
For each bar in the graph, the system will test it to see if it meets the conditions defined in the rules.
If a bar fulfills the condition of a rule, the colour of the rule will be applied to the bar. If not, the system will check the next rule defined.
If a bar doesn't fulfill any conditions, it will keep its default color.
2.2.11.4.2. Create a rule
To create a rule for a colour template, the following data is required:
- Left shift on the current bar (0 if only the current bar is wanted).
- Type of value to compare from the previous bar.
- Type of comparison.
- Left shift on the current bar (0 if wanted only the current bar).
- Type of value to compare with the following bar.
- Colour to be applied in case the rule is fulfilled.
2.2.11.4.3. My templates
Allows users to manage and apply the colour templates previously created and to deactivate the current template.
2.2.12. Show/Hide volume

Show/Hide volume Shows or hides the volume of the share that is displayed in a graph below the price graph.
2.2.13. Timing
Alternates to display daily, weekly or monthly information.
2.2.14. Time range
Allows user to define the time range to represent in the chart, until the last available date.
In the case of having one of the ranges selected, when a new graph is displayed the time range will be extended to cover any new value.
Tip: if zoom is applied on the chart or the chart is moved in the x-axis, the time range selected will be deactivated.
2.2.15. Zoom

Select the tool then click on the chart and drag the mouse to define a section that will be expanded to fill the entire chart area.
2.2.16. Zoom in

Zooms in on the graph.
2.2.17. Zoom out

Zooms out of the graph.
Tip: placing the mouse on the time axis (x-axis), the zoom can also be controlled by combining the Alt key + the mouse scroll
2.2.18. Latest stocks visited

In this area we store the last visited searches.
By clicking over the ticker, you can see this ticker again with all the changes you made in it, like items, indicators...
If you want to delete one or more tickers from here, you have to click over the red x that appears when you put over the ticker with the mouse.
2.2.18.1. Save latest stocks visited
If you subscribe to a PRO or PREMIUM plan may directly saved the last tickers visited. The last 10 in the case of PRO and all in the case of PREMIUM.
To do this, place yourself above the clock icon that is located to the left of the last visited tickers and click the left mouse button. A drop-down will appear to choose the workspace where you want to save.
2.3. Sidebar
2.3.1. Workspaces (login required)

Note: login is required to see this button.
The workspaces are intended to help you to organize the charts stored in Stonicks. Directories can also be created inside the workspaces in order to be better organized.
Tip: choose the workspace or directory in which you want to store a chart.
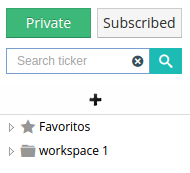
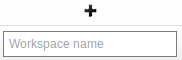
2.3.1.1. New workspace

Click on new workspace button and introduce the name of the new workspace.
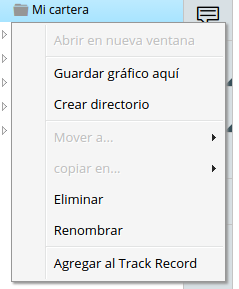
2.3.1.2. Contextual Menu Right button
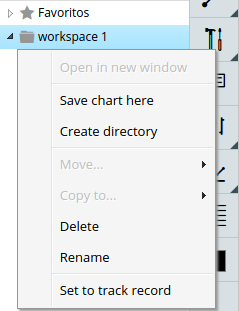
This element can be a workspace, a directory or a chart.
2.3.1.2.1. Save the chart here
This option is only available when the element of the contextual menu is a workspace or a directory. It allows the user to save the chart as it is displayed in the workspace or directory and assign it a name.
2.3.1.2.2. Create directory
This option is enabled when the element of the contextual menu is a workspace or a directory. It allows the user to generate a directory within a workspace or directory and to assign it a name.
2.3.1.2.3. Copy
This option is enabled when the element of the contextual menu is a workspace. It allows users to copy charts or directories.
2.3.1.2.4. Cut
This option does not work if the element of the contextual menu is a workspace. It allows users to cut charts and directories.
2.3.1.2.5. Paste
This option is only operative if the element of the contextual menu is a workspace or a directory. It allows to paste charts or directories, that have been copied or cutted, in the selected workspace or directory.
2.3.1.2.6. Rename
Allows to rename the element of the contextual menu. Workspaces and directories can be renamed. Charts cannot be renamed.
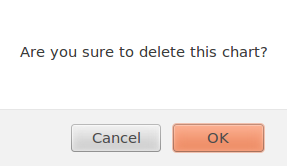
2.3.1.2.7. Delete
Allows to delete the element of the contextual menu. Any type of contextual element can be deleted in the private area.
Be careful! If you delete a workspace or a directory you will also delete all its content.
2.3.1.3. Show or hide content in a workspace or directory
Click on the name of the workspace or directory to swap between showing or hiding its content.
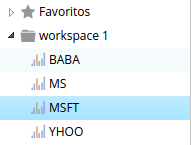
2.3.1.4. Move charts or folders with click & drag
When you left click on a chart or directory and drag the mouse, you will move it to another workspace or directory.
2.3.1.5. Search in the workspace
The search field can be used in both private and subscribed workspaces. Some details should be taken into account IMPORTANTES
- The search is made by the company name.
- There tree has to be expanded in order to be considered during search.
2.3.2. Templates (login required)

Note: login is required to see this button.
The templates are designed to help you apply patterns on your charts. One template can be saved by setting your timing, color, indicators, scale, chart type .... To then apply it to different tickers or saved workspaces.
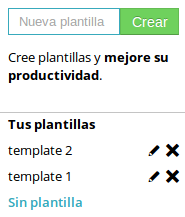
2.3.2.1. New Template
To create a new template set any ticker you have open at the time with the scale, color, line width, indicators, timing or chart type.
Once you have configured left enter the name you want to give the new template and click create.
2.3.2.2. Edit Template
Click the edit button on the template and a menu where you can change the values of the same appear.
2.3.3. Lines

On mouse hover all different type of lines will be shown in a drop down menu.
2.3.3.1. Line
Click on the chart to start drawing the line, drag the mouse to the end point and release it.
Tip: double click on a line to extend its length.
Tip: right click on a line to open the menu to create a parallel line, to modify its colour and width or to modify its properties.
Tip: by default, the lines stick automatically to the points of the chart. If you keep the shift button pressed whild drawing a line, you will disable it.
2.3.3.2. Horizontal line
Click on the graph area and drag the mouse up or down to draw the line in the desired point. When the mouse is released, the line will be drawn and adjusted to the closet point of the graph. Next, you can adjust the position of the line by clicking on it and draggin the mouse, and this time the line will no be adjusted to any point.
Tip: right click on a line to open the menu to create a parallel line, to modify its colour and width or to modify its properties.
2.3.3.3. Vertical Line
Click on the graph area and drag the mouse left or right to draw the line in the desired point. When the mouse is released, the line will be drawn and adjusted to the closet point of the graph. Next, you can adjust the position of the line by clicking on it and draggin the mouse, and this time the line will no be adjusted to any point.
Tip: right click on a line to open the menu to create a parallel line, to modify its colour and width or to modify its properties.
2.3.3.4. Regression line
Click on the chart to start drawing the line, drag the mouse to the end point and release it. To adjust the line click on the circle at any of both ends of the line and drag the mouse.
2.3.3.5. Fibonacci
Click on the chart to start drawing the line, drag the mouse to the end point and release it. To adjust the line click on the circle at any of both ends of the line and drag the mouse. If you click on any other part of the fibonacci lines and drag the mouse you will move the entire set of lines.
2.3.3.6. Box
Click on the chart to start drawing the line, drag the mouse to the end point and release it. There is a circle at each vertex of the box, that you can click on and drag to resize the box.
2.3.4. Tools

2.3.4.1. Vertical ruler
It allows to messure a section of values of the chart covered by the ruler. More specifically, the values of the upper end point and lower end point of the ruler and the distance between them.
2.3.4.2. Horizontal ruler
It allows to messure the number of time units covered by the ruler. The time units can be days, months or years, depending on the Timing selected. If days are selected, the ruller will only take into account the days when the stock market is open.
The rule adheres to the chart bars for a more precise calculation.
2.3.4.3. Reverse chart
It allows to mirror a graph horizontally.
2.3.5. Note

Click on the graph to place the upper left corner of the note. Then, write the text of the note. The size of a note can be modified by clicking on the right down corner arrow and dragging the mouse. The position of a note can be modified by clicking on the upper left corner circle and dragging the mouse.
When a note is not selected, only the circle is visible.
Tip: right click on a note to make its text always visible or to hide it.
2.3.6. Type

Mouse over the icon to display the drop down menu that contains the different types of charts.
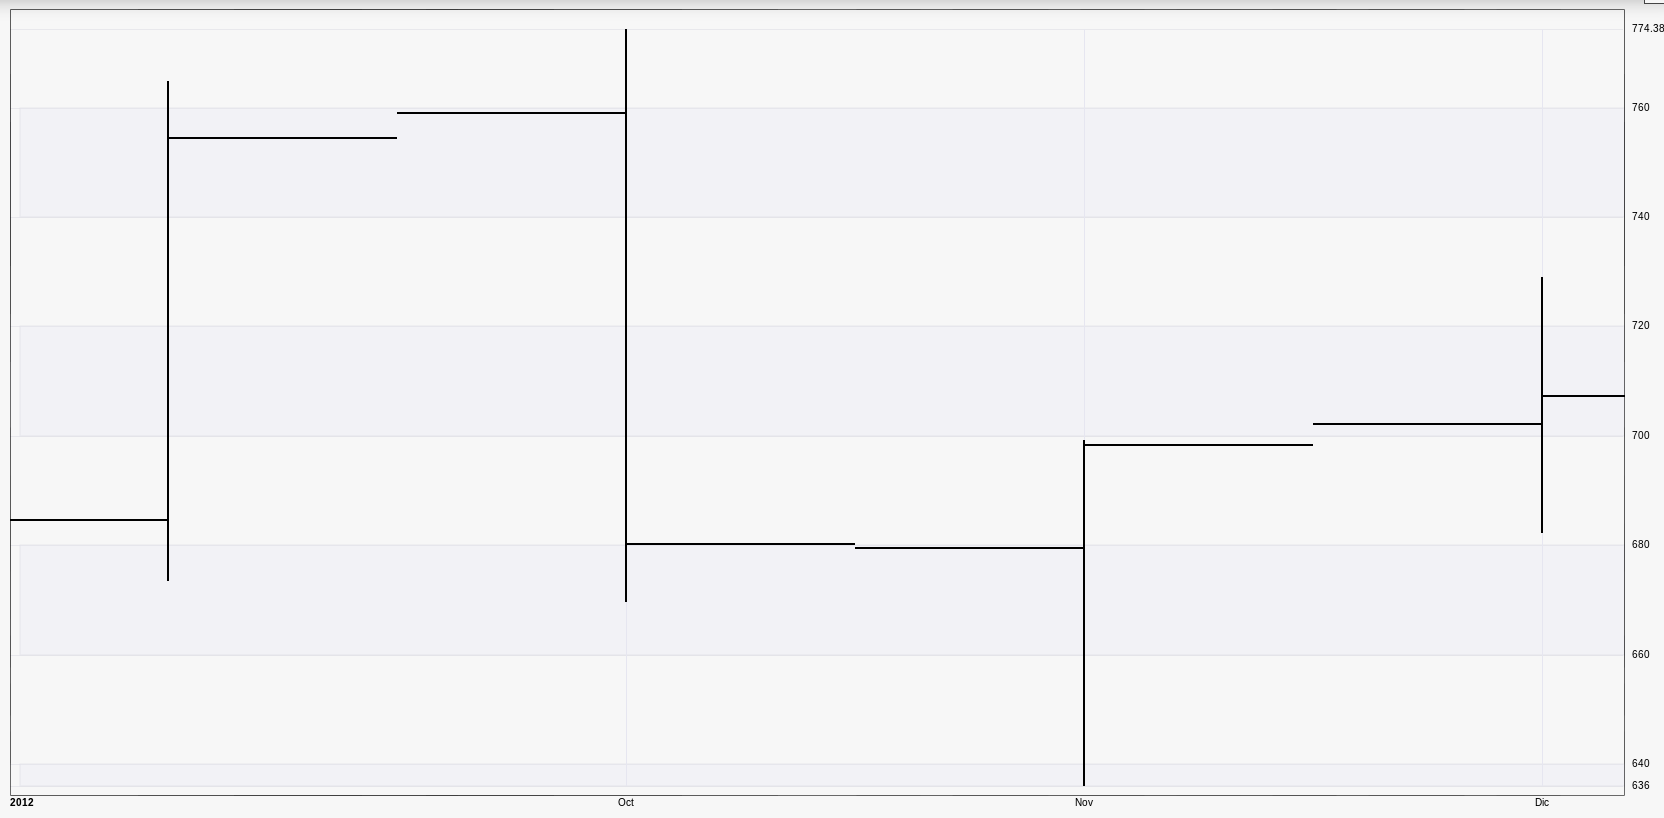
2.3.6.1. OHLC
OHLC chars (Open High Low Close) show graphically, as its name states, the intial value of the share in a period (left horizontal line), the maximum value of the period (highest point of the vertical line), the minimum value of the period (lowest point of the vertical line) and the value at the end of the period (right horizontal line).
2.3.6.2. Máximum and minimum

The maximum and minimum graph is a simplified version of the OHLC, that does not show the open and close lines.
2.3.6.3. Candle

Ech candle in the japanese candles contains the values maximum, minimum, open and cloe of a determinate period of time. This is the most popular chart.
2.3.6.4. Linear

A linear chart represents the line that connects all close prices in a period of time.
2.3.6.5. Capitalization chart

This chart is diferent to the previous charts and shows the value of the market capitalization of the company over time.
2.3.7. Indicators

Some indicators are displayed directly on the main chart area, while some others are displayed in an additional area below the main chart area.
The properties of each indicator can be configured in the configuration menu, in the technical indicators, or by clicking the right mouse button on the corresponding indicator line.
2.3.7.1. Disable indicators
Deletes all indicators currently displayed in the main chart and in the secondary chart.
2.3.7.2. RSI
Displays the RSI (Relative Strength Index) indicator in the secondary chart.
2.3.7.3. SMA
Displays the SMA (Simple Moving Average) indicator in the main chart.
2.3.7.4. EMA
Displays the EMA (Exponential Moving Average) indicator in the main chart.
2.3.7.5. WMA
Displays the WMA (Weighted Moving Average) indicator in the main chart.
2.3.7.6. Keltner Channel
Displays the Keltner Channel indicator in the main chart.
2.3.7.7. Stochastic
Displays the Stochastic indicator in the secondary chart.
2.3.7.8. MACD
Displays the MACD indicator in the secondary chart.
2.3.7.9. Range Channels
Dispalys the Canales de rango indicator in the main chart.
2.3.7.10. Bollinger Bands
Dispalys the Bollinger Bands indicator in the main chart.
2.3.7.11. Parabolic SAR
Dispalys the PSAR (Parabolic Stop and Reverse) indicator in the main chart.
2.3.7.12. Momentum
Seleccionar como indicador actual Momentum. Se muestra en el gráfico auxiliar.
2.3.7.13. Rate of Change
Dispalys the Rate of Change indicator in the secondary chart.
2.3.7.14. %R Williams
Dispalys the %R Williams indicator indicator in the secondary chart.
2.3.7.15. Acumulated Distributed
Dispalys the Acumulated Distributed indicator in the secondary chart.
2.3.7.16. ADX
Dispalys the ADX (Average Directional Index) indicator in the secondary chart.
2.3.7.17. ATR
Dispalys the ATR (Average True Range) indicator in the secondary chart.
2.3.8. Linear/logarithmic scale

Swaps between the linear and logarithmic scale. In linear scale the accuracy keeps constant for all the values of the share. In the logarithmic scale, the accuracy lowers down as the value of the share increses.
2.3.9. Change the color of the graphical elements

Changes the color of the graphical elements selected. Besides, when a color is selected, the next graphical elements that are drawn take this color.
2.4. Main chart
2.4.1. Horizontal axis: dates
Dates for which information is displayed in the chart. Dates are located at the bottom of the chart area. The separation between dates is always the same. The years and months are marked in the axis only once at the begining. When zooming in it is likely to loose this signs. Therefore, the month and year are displed in the left corner from a given level of zoom, to allow keeping the time reference.
2.4.2. Vertical axis: values
Display of the range of values of the share in the right hand side of the chart.
Tip: the range of values can be moved by left clicking the mouse on the scale and dragging. Double click on the vertical axis to restore the initial scale range values.
Tip: double click on the main chart area to restore the initial range of both x and y scales.
2.4.3. Information displayed when the mouse pointer is moved over the chart line

2.4.3.1. Date
Date of the data displayed.
2.4.3.2. O
Open value.
2.4.3.3. H
Maximum (highest) value.
2.4.3.4. L
Minimum (lowest) value.
2.4.3.5. C
Close value.
2.4.3.6. Current
The real value (current) correspondint to the height where the mouse pointer is placed in the chart.
2.4.4. Future date
The chart can be moved to future date.
click on the x axis and drag the mouse to the left.
2.4.5. Zoom with mouse
Place the mouse pointer on the time axis (x-axis), then press Shift and move the scroll wheel of the mouse to zoom in or zoom out the chart.
2.4.6. Move the chart
2.4.6.1. Move the chart in the time axis
To move the chart in the time axis (x-axis), left click the mouse on the dates of the x-axis and drag it left or right.
Tip: When the mouse pointer is placed over the x-axis, the chart can be also moved left or right using the mouse scroll wheel.

2.4.6.2. Move the chart in the value axis
To move the chart in the time value axis (y-axis), left click the mouse on the values (numbers) of the y-axis and drag it left or right.
2.4.6.3. Move the graph with arrows
To move the chart step by step click on the arrows placed left in the botton of the screen. When the chart is in OHLC or candles the chart will be moved bar by bar on every click.

2.4.7. Current Value
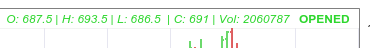
The current value allows us to visualize the values OHLC of stock if we are at trading time. Visually we can know if the aperture value (O) is smaller or larger than the current (C) for the color of the text string (green O
2.5. Track record
What is the track record?
The track record is used to show the evolution of a portfolio. In Sonicks, a portfolio will be associated with a workspace.
What information is provided by the track record?
In the track record you will see the evolution of the value of a porfolio or workspace and the rentability since it was created.
How can I create a track record from my workspace?
In version V3.3.0 of Stonicks you can only select one of you workspaces for Track Record. In order to activate the track record management, you have to right-click on the desired workspace with the mouse and select the option 'Add to Track Record'. The next step is to select the initial amount of the portfolio and the currency. Next you have to indicate for each Stock the amount to buy or short sell (by selecting the bearish check box).
2.5.1. Activate
In order to activate the track record management, you have to right-click on the desired workspace with the mouse and select the option 'Add to Track Record'.
2.5.2. Track record tab
In this paragraph you can find the detail of the different sections of the Track Record Tab
2.5.2.1. Select portfolio
In this section you can choose the porfolio that you want to manage. Initially and during the beta test period you will only be allowed to manage one portfolio.
Here you can also remove a portfolio by clicking on the X. A portfolio cannot be eliminated once it has been ckecked as 'shared' portfolio. Initially, and during the beta-test period all portfolios will be shated with other users, but only the rentability and value will be displayed, not the stocks of the portfolio.

2.5.2.2. Add ticker
In order to add a new ticker from the Track Record screen, you have a text box that will search for any ticker or company that you introduce in the same way it does the search text field of the Stonicks main screen. Once you find the desired Stock you have to click on the Add button. This way the Stock will be automátically added to the Stocks section.
You can also add new tickers from the main screen of Stonicks by adding a ticker to the track record. In this case you will have to refresh the track record screen

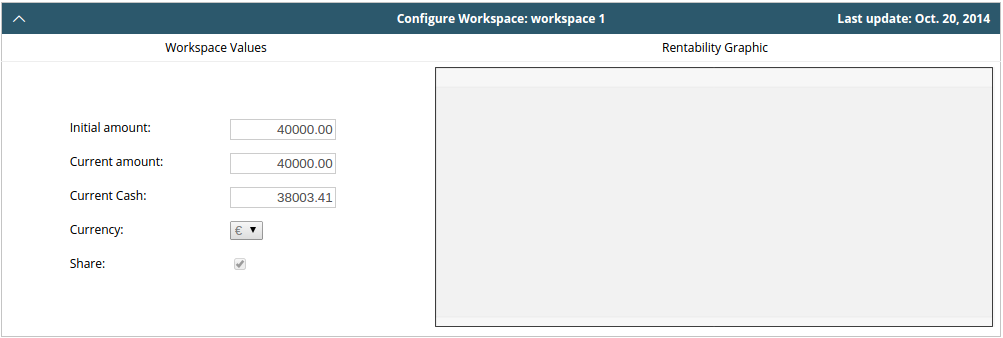
2.5.2.3. General configuraion
In the general configuration section you will have to define the general parameters of the portfolio: the initial amount and the currency. The currency is limited to US dollar and Euro.
In this section it is also displayed the current value of the selected portfolio, the spare cash that can be used to operate and a graph with the evolution of the rentability of the portfolio.
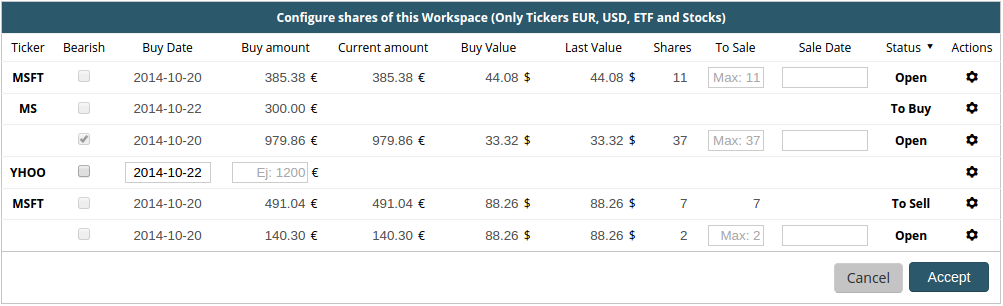
2.5.2.4. Tickers' configuration
In this section, you will have to indicate the initial amount that you want to invest in each Stock, and if you want to invest bearish or bullish. The column 'status' can have the following values:
- to_buy:Pending to buy, the order will be executed during the next update, meanwhile the order can be cancelled. When the order is executed, the system will buy the maximum number of shares considering the amount indicated and will return back to the cash the remaining amount.
- open: Open position.
- to_sell:Pending to sell, the order will be executed during the next update, meanwhile the order can be cancelled. In order to sell a Stock, you can define the number of shares that you want to sell in the box 'Sell shares' and then click on the Accept button. You can also close the position and sell all the shares of a Stock by means of a menu that is displayed in the column 'Shares'. The option 'Close position' will sell all the shares of the selected Stock.
- close:Once a Stock has been completely sold, it will be displayed as 'closed'.
2.5.2.5. Closed operations
In the closed operations section, you can find a list of all the operations that have been closed in the portfolio
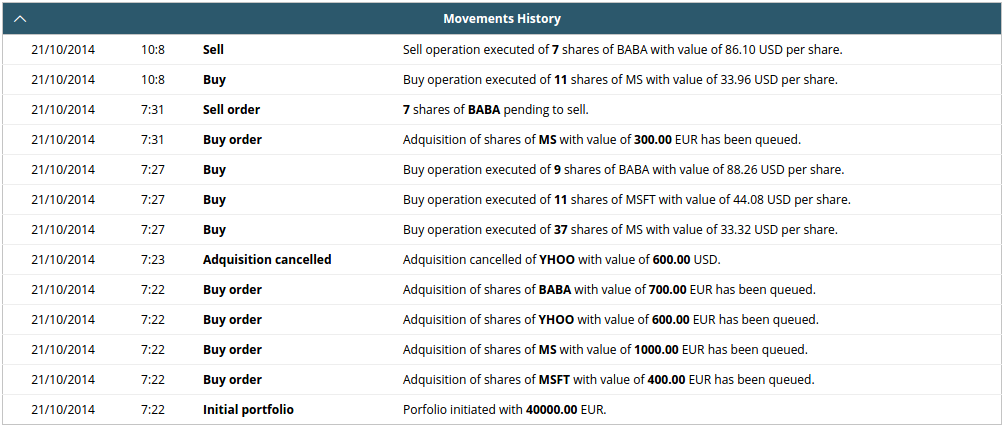
2.5.2.6. Movements history
Finally, in the movements history section, there is a record of all the movements that have been made in the portfolio.
2.5.3. Portfolio update
The portfolio will be updated daily when Stock Markets closed.
2.6. Latest relevant closures
